Documentation
Debugging
Viewing signals
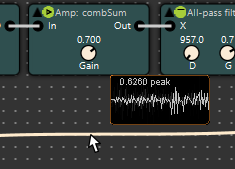
During normal execution, hovering over a wire brings up signal monitor.
Another useful tool is Scope component which is a simplified oscilloscope with two channels, single timebase and separate magnitude settings.
Debugging
Debugging function allows pausing execution, executing processing on a single sample, and resuming execution. These functions are available in the toolbar.

- Clicking on the pause button, pauses execution .
- Clicking on the step button, progresses execution by one sample.
- If the Run / Stop button is clicked while debugging, execution will stop.
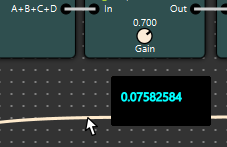
While paused, you can mouse over wires to see signal value, step and repeat.
While debugging, it’s always a good idea to include the Time Display component in the design. This allows us to see time and sample position we are operating on. Scope can also be used with debug pause button to freeze exection and view a length of signal.
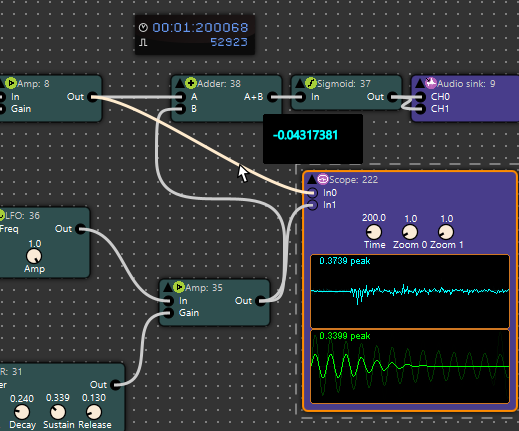
In the above image we show a paused instrumented design that combines these techniques.